Geodata Pixel User Manual
Introduction
Geodata Pixel is a solution for efficient management of geospatial data. With Geodata Pixel, you get a common place to upload, store and structure image data, raster data and point cloud data, making it easy to find and manage data based on time and place. The solution consists of a web application, a Python client, an API and integration with ArcGIS services.
The solution offers sharing mechanisms based on ArcGIS and provides opportunities for both internal and external sharing when needed. Safe storage of photos is secured and anonymization of sensitive data is included.
Access to the solution
The solution is web-based with the following structure: https://geodatapixel.no/{tenant}.
Where {tenant} is your organization's tenant ID. Contact your administrator for your specific tenant URL.
Access to the solution is user controlled with e-mail as username and a personal password.
User interface
When you log in to the solution, you will be taken to a landing page with an overview of your projects and data collections. The interface consists of three main areas:
- Top navigation bar — Contains a global search bar, view mode tabs (Dashboard / List / Map), a Create button for new projects and data collections.
- Left sidebar — The project list and links to admin pages (Map Services, Data Harvest Services, Users, Access, Documentation).
- Main content area — Displays your data collections in the selected view mode (dashboard cards, list or map).
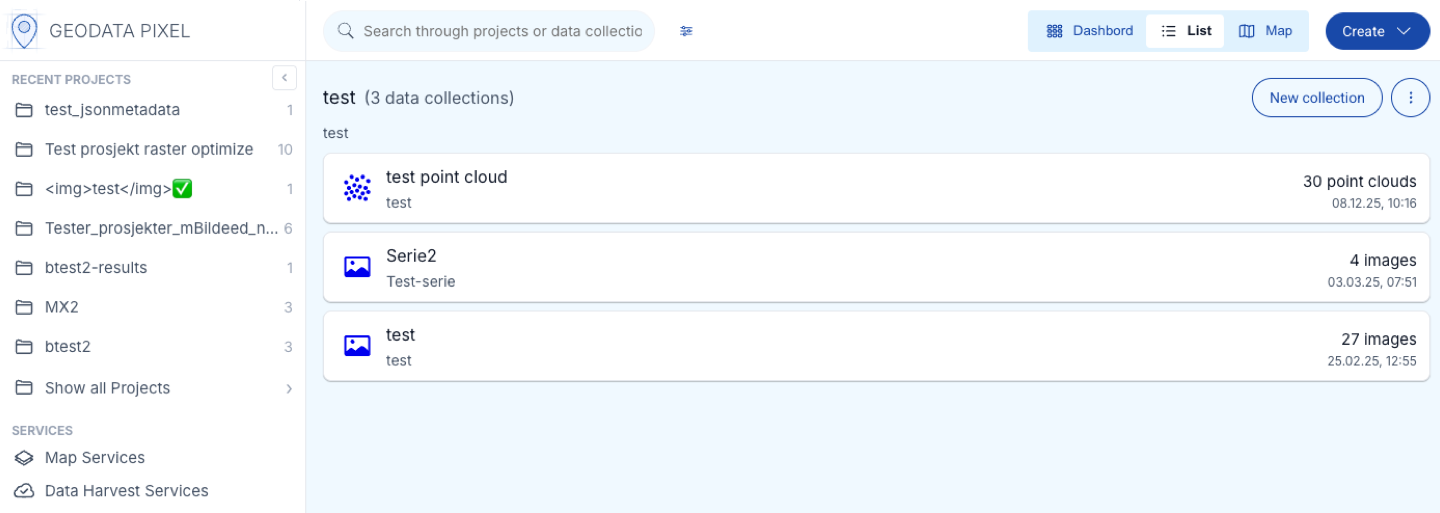
View modes
You can switch between three view modes using the tabs in the top navigation bar:
- Dashboard — Shows data collections as cards in a grid layout, with a map panel and attachments section.
- List — Shows data collections in a table format.
- Map — Shows data collection locations on a full-width map with project boundaries.
Search and filtering
Global search
The search bar in the top navigation bar allows you to search across all projects, data collections, images, rasters and point clouds. As you type, autocomplete suggestions appear for matching projects and data collections. Press Enter or click a suggestion to navigate to the search results.
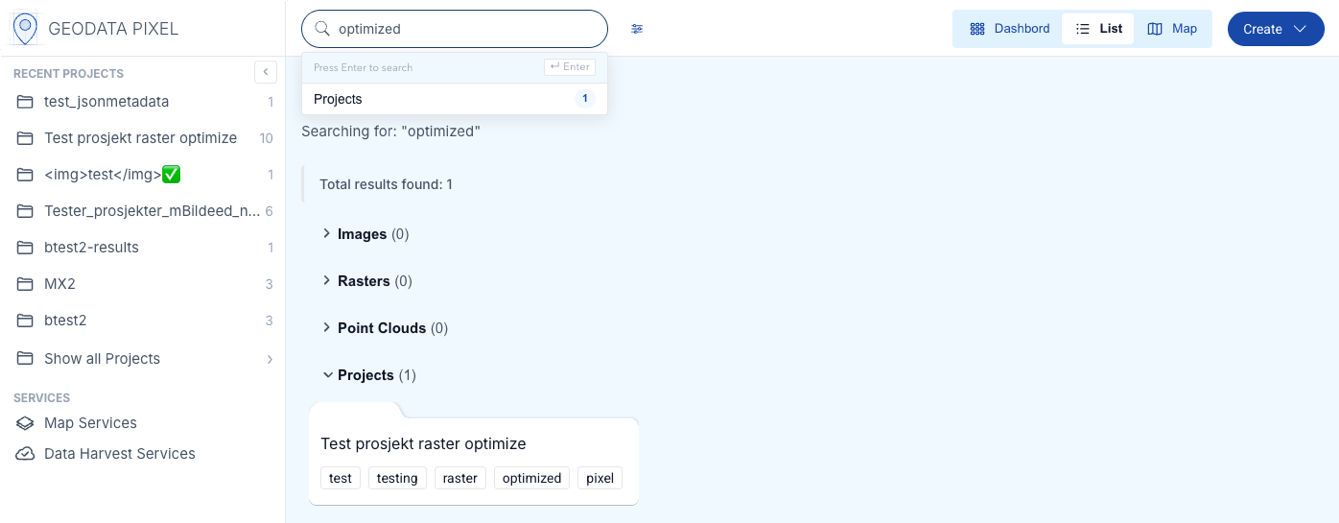
Search results page
When you press Enter in the search bar, a dedicated search results page opens. Results are grouped by category (Projects, Images, Point Clouds, Rasters), making it easy to find what you are looking for. The page uses infinite scroll — more results are loaded automatically as you scroll down.
Filtering
Click the filter icon next to the search bar to toggle the filter panel. When active, a filter row appears below the search bar with the following options:

- Text filter — Free-text filter to narrow results by name.
- Data collection type — Filter by type (Image, Raster, RGB, DTM, DSM, Point Cloud).
- Tags — Select one or more tags to filter by.
- Date — Select dates to filter by.
- Sorting — Sort by date (ascending/descending) or alphabetically.
Click Reset all filters to clear all active filters, or Hide filter to collapse the filter row.
Projects
The data model in Pixel uses projects as the main organizational element. Projects contain data collections and can be nested with subprojects.
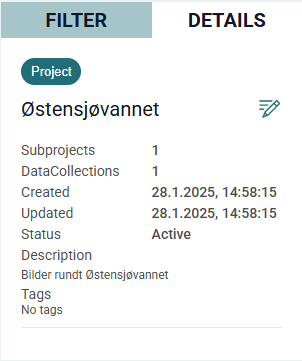
Project list
In the left sidebar, you will find a hierarchical list of available projects that you have created or that have been shared with you. Each project can be expanded to show its subprojects and data collections. Select a project to see its details in the main panel.
Create new project
To create a new project, click the Create button in the top navigation bar and select New project. A dialog will appear where you can fill in the following information:
- Project name (required)
- Project description
- Tags — Add relevant tags to make the project searchable.
- Project area — Draw a polygon on the map to define the project boundary. This polygon is used for validation when uploading data.
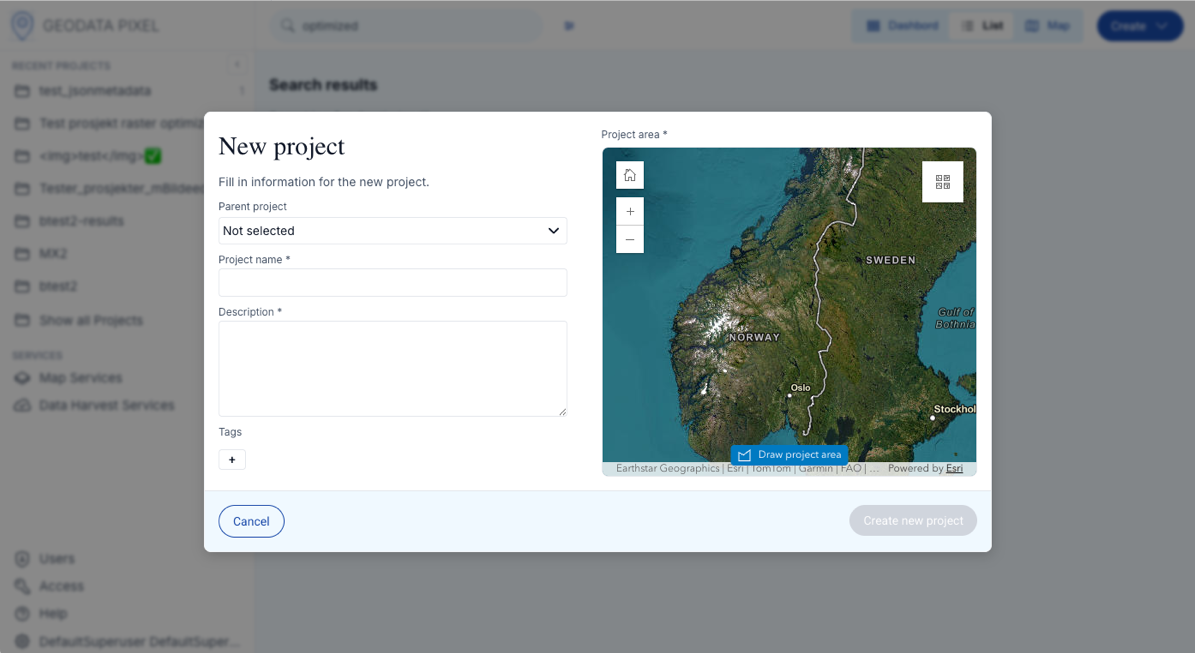
Drawing a project area
Click the Draw project area button to start drawing a polygon on the map. Use the mouse wheel to zoom and click-and-hold to pan. Click to add points to the polygon, and close it by clicking on the first point or double-clicking.
You can drag the handles to adjust the polygon after drawing. Once you are satisfied with the project area and information, click Save to create the project.
Subproject
To further organize a project, you can create subprojects. A subproject has the same properties as a main project (name, description, tags and polygon).
To create a subproject, use the Create button in the top navigation bar and select New project. In the project dialog, select a parent project from the project tree. The new project will be created as a subproject under the selected parent.
Edit or delete a project
To edit or delete a project, navigate to the project and click the three-dot menu button next to the New collection button. The menu (visible for Admin users) contains the following options:
- Edit — Opens the project dialog where you can change the name, description, tags and project area.
- Delete project — Removes the project and all its contents. This action cannot be undone.
Data collections
A data collection is a container for uploaded data within a project. Each data collection holds a single type of data. The following types are supported:
| Type | Description |
|---|---|
| Image | Standard photographs (JPEG, PNG, etc.) with GPS metadata |
| Raster | Generic geospatial raster data (GeoTIFF, JPEG2000, etc.) |
| RGB | RGB raster imagery (3-4 bands, uint8) |
| DTM | Digital Terrain Model (single band, float32/float64) |
| DSM | Digital Surface Model (single band, float32/float64) |
| Point Cloud | 3D point cloud data (LAS, LAZ, COPC) |
Data type separation
A data collection can only hold data of a single type.
Image sub-types
Image data collections support the following image types: Horizontal, Oblique, Nadir, 360 and Inspection. The image type is set per image during upload or in the image viewer. See Image types for details.
Create data collection
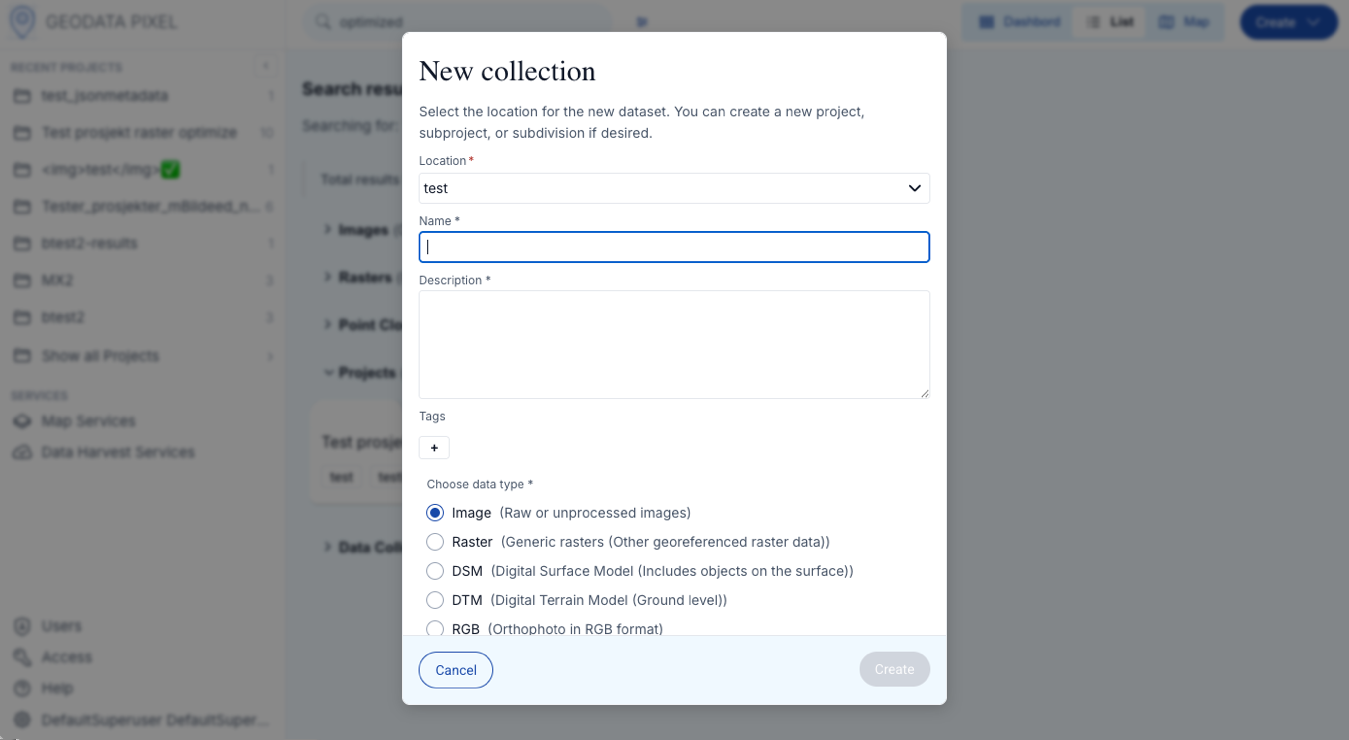
To create a new data collection:
- Click the Create button in the top navigation bar and select New collection.
- Fill in the required information:
- Project (required) — Select the parent project from the project tree. You can also create a new project inline.
- Name (required)
- Description (required)
- Tags
- Select the data type from the available options.
- Click Save to create the data collection, or continue to upload files directly.
Raster data collections
When creating a raster data collection (Raster, RGB, DTM or DSM), you will be asked to configure rules for the raster data. These rules ensure consistency in the uploaded data:
- Spatial reference ID (SRID) — The expected coordinate system (EPSG code). Optional for all types.
- Data type — The expected data type (uint8, int16, float32, float64, etc.). Optional for generic Raster. Must be uint8 for RGB, float32 or float64 for DTM/DSM.
- Cell size — The expected pixel size in coordinate system units. Optional for all types.
- Format — The expected file format (GTiff, PNG, JPEG, MRF, PDF). Optional for generic Raster. Must be GTiff for DTM/DSM, GTiff or JPEG for RGB.
- Band count — The expected number of bands. Optional for generic Raster. Must be 1 for DTM/DSM, 3 or 4 for RGB.
If specified, all rasters uploaded to the data collection must match these rules.
Technical details
For more technical details see the Python Pixel Client Documentation
Image data collections
No additional configuration is needed. You can start uploading images directly after creating the data collection.
Point cloud data collections
No additional configuration is needed. After upload, non-COPC files will be automatically optimized to COPC format.
Upload data
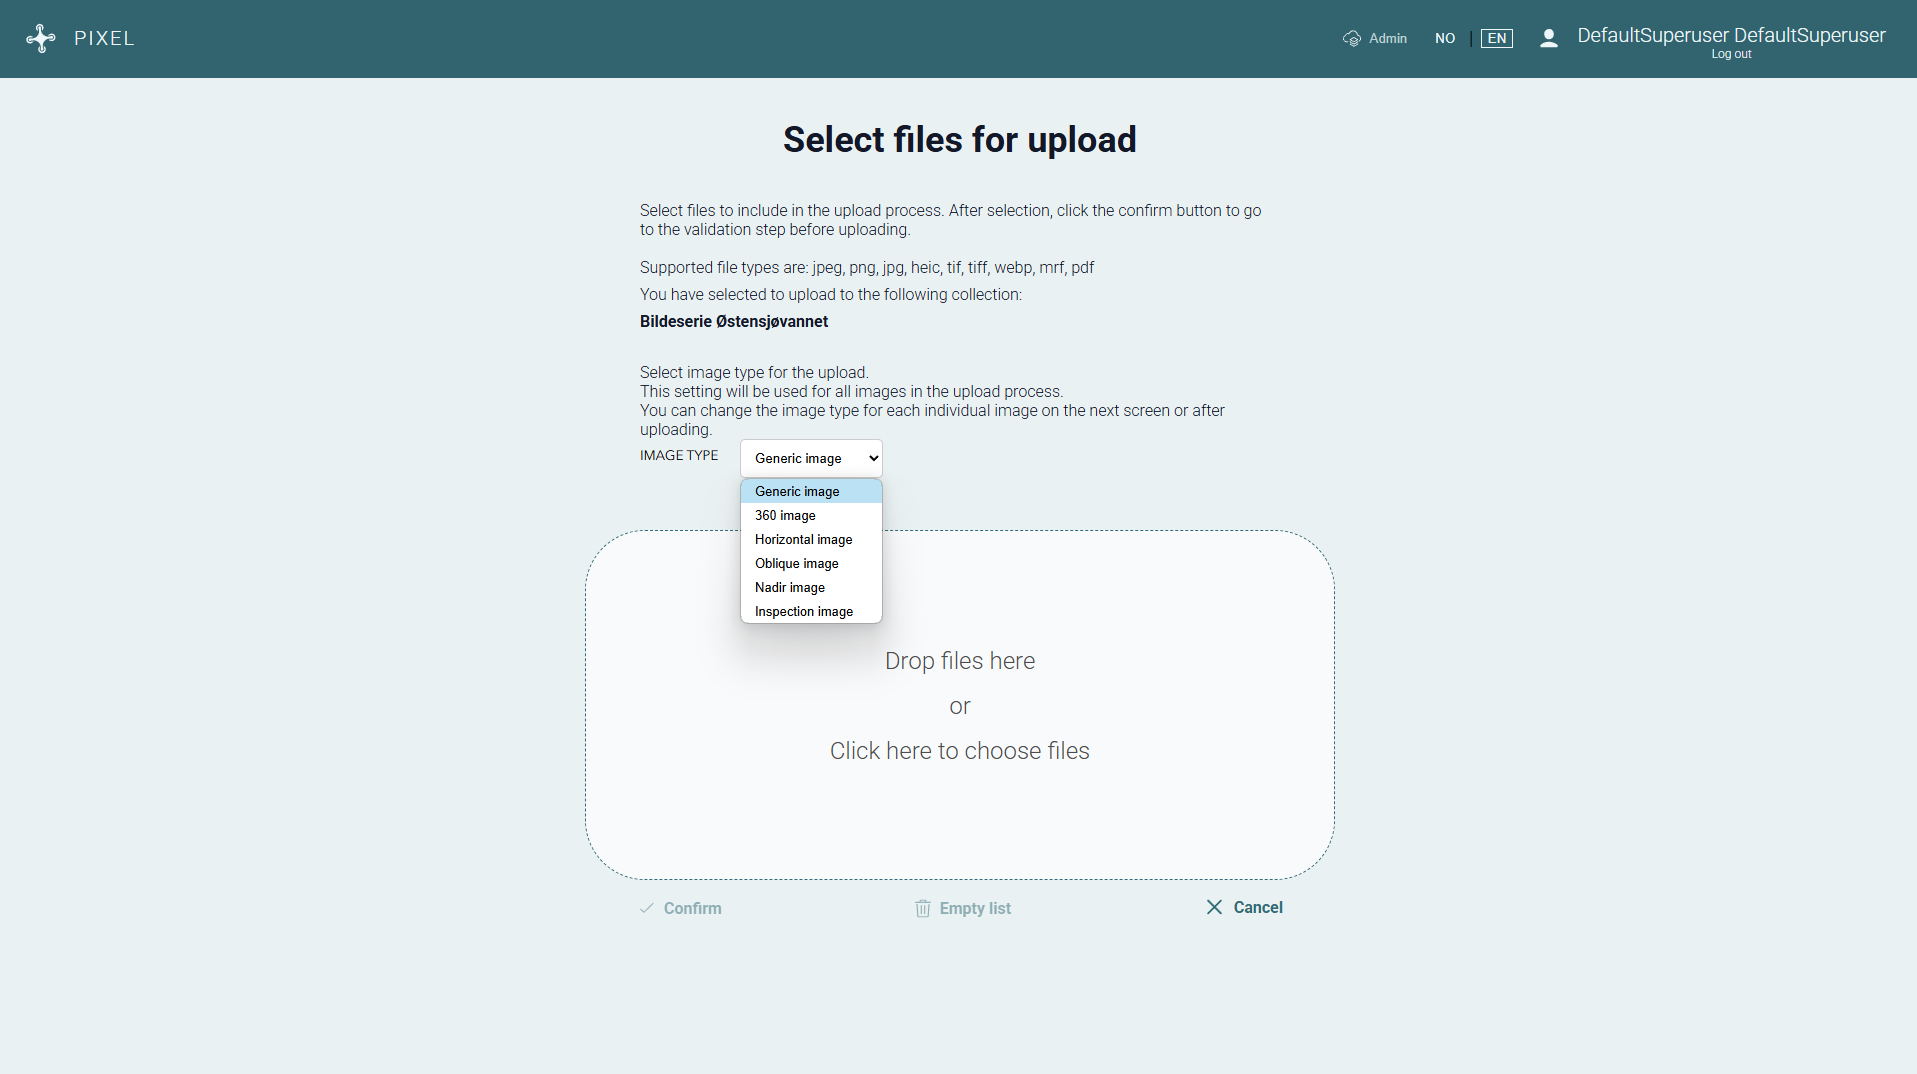
All data types share the same upload flow. To upload data to a data collection:
- Open the data collection and click Upload, or use the upload section directly when creating a new data collection.
- Drag and drop files into the upload area, or click choose files from this computer to browse.
- The application validates files automatically (see below).
- Click Upload to start uploading.
The upload runs in the background — you can close the dialog and continue working. Toast notifications will inform you when the upload is started, completed or if it fails.
Validation
When files are added, the application validates them automatically:
- GPS location — Images without GPS metadata will receive a warning. You can manually set the location on the map.
- Project area — Images located outside the project boundary will be flagged.
- Duplicate filenames — Files with duplicate names will trigger a warning.
Manage metadata (images)
Before uploading images, you can review and edit metadata:
- Use the simple metadata editor below the map to set image type, camera heading and capture date for individual files. Fields extracted from EXIF are indicated with a badge.
- Select multiple files and click Edit selected files to open the advanced metadata editor, where you can map EXIF fields to custom metadata fields and add extra JSON metadata.
- Apply changes to selected files or all files at once.
Images
Supported formats: JPG, JPEG, PNG, HEIC, WEBP.
Rasters
Select all files that belong to a single raster dataset. This can be a single GeoTIFF file or multiple files including support files:
- *.tfw (GeoTIFF World File)
- *.pgw (PNG World File)
- *.jgw (JPEG World File)
- *.prj (Projection file)
- *.aux.xml (Auxiliary XML file)
- *.ovr (Overviews file)
- *.xml (XML metadata file)
- _.idx, _.pjg (MRF index and data files)
Support files are automatically recognized and grouped with their main raster file. The upload page displays the extent of the raster dataset on the map.
Point clouds
Supported formats: LAS, LAZ, COPC.
After upload, non-COPC files are automatically optimized to COPC format in the background. The file list shows the optimization status for each file (Pending, Processing, Complete, Failed).
Managing data
Once data has been uploaded to Geodata Pixel, you can perform several operations on projects, data collections and individual files.
Bulk operations
In the image viewer, raster viewer and point cloud viewer, you can select multiple files using the checkboxes in the file list. With multiple files selected, the following actions are available in the action bar:
- Edit metadata — Edit metadata for all selected files at once.
- Delete — Delete all selected files.
- Download as ZIP — Download all selected files as a single ZIP archive.
Download
Selected files can be downloaded as a ZIP archive. Select the files you want to download using checkboxes and click the Download button. The archive is prepared server-side and the download starts automatically when ready.
Image viewer
When you open an image data collection, you enter the Image Viewer. The viewer has three panels:
- Left panel — File list with tabs for Original and Processed images. You can select multiple images using checkboxes for bulk operations.
- Center panel — Large image display with navigation arrows to browse between images.
- Right panel — Three collapsible sections:
- Metadata — View and edit EXIF data, location and custom metadata.
- Location map — Shows image locations on a map. You can edit the location by clicking on the map.
- Map services — Shows published ArcGIS services that include this data collection.
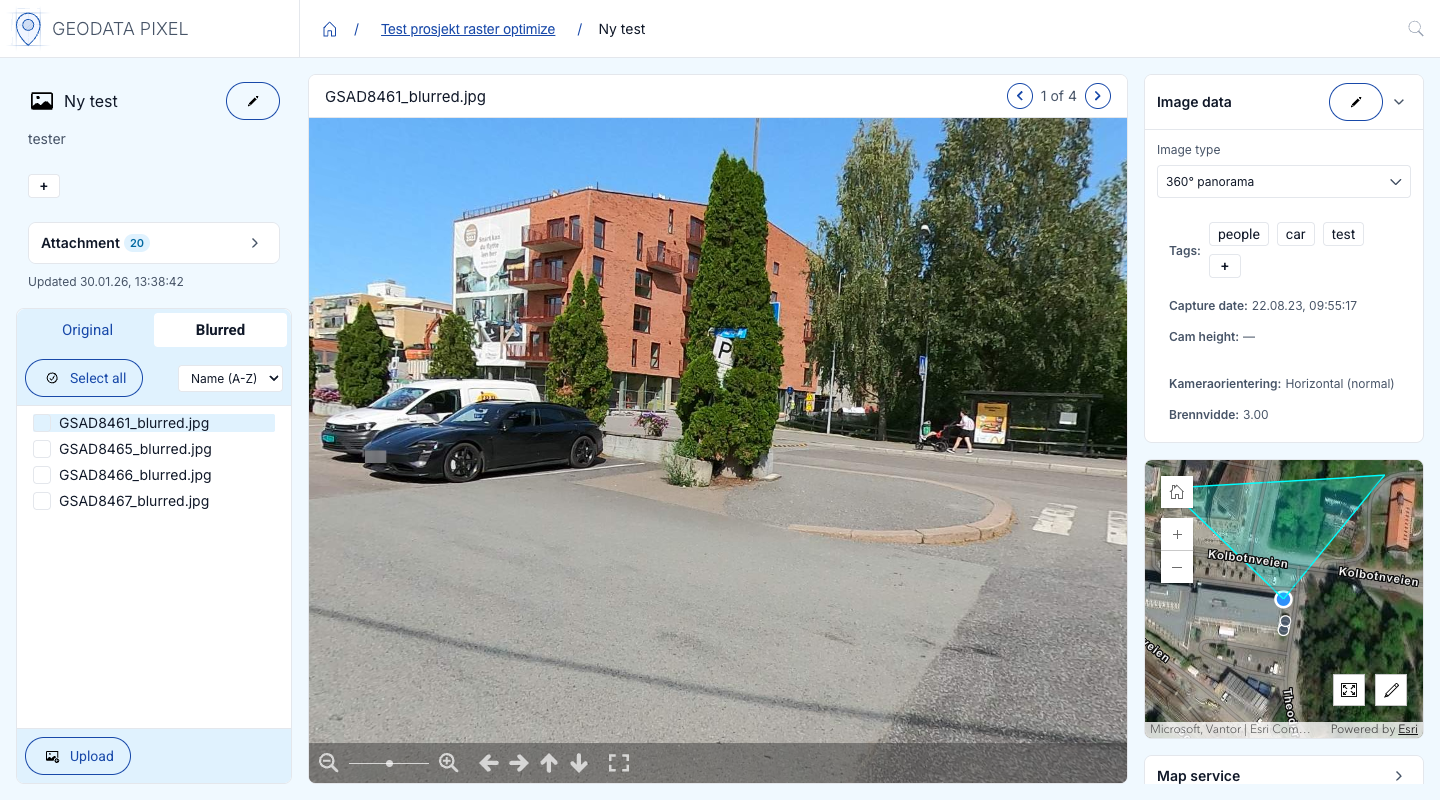
Image types
Each image in a data collection has an image type that determines how it is displayed in the viewer:
- Horizontal — Standard landscape/portrait photographs.
- Oblique — Angled aerial photographs.
- Nadir — Straight-down aerial photographs.
- 360 — Panoramic 360-degree images. These open in an interactive panorama viewer where you can look around in all directions.
- Inspection — Close-up inspection photographs.
The image type can be set during upload or edited later in the metadata panel.
EXIF metadata
The metadata panel shows extracted EXIF data including:
- GPS coordinates — Latitude, longitude and altitude.
- Camera orientation — Heading, pitch and roll.
- Field of view — Horizontal (HFOV) and vertical (VFOV) field of view.
- Camera height — Height of the camera above ground.
- Focal length — Lens focal length.
- Capture date — Date and time when the image was taken.
Image viewer actions
- Download — Download selected images as a ZIP archive.
- Delete — Delete selected images (requires editor or admin permissions).
- Bulk edit — Select multiple images and edit metadata, tags or image type in bulk.
- Processed images — Use the tab to view processed variants of images:
- Original — The uploaded image as-is.
- Blurred — Anonymized version with sensitive content (license plates, faces) blurred out.
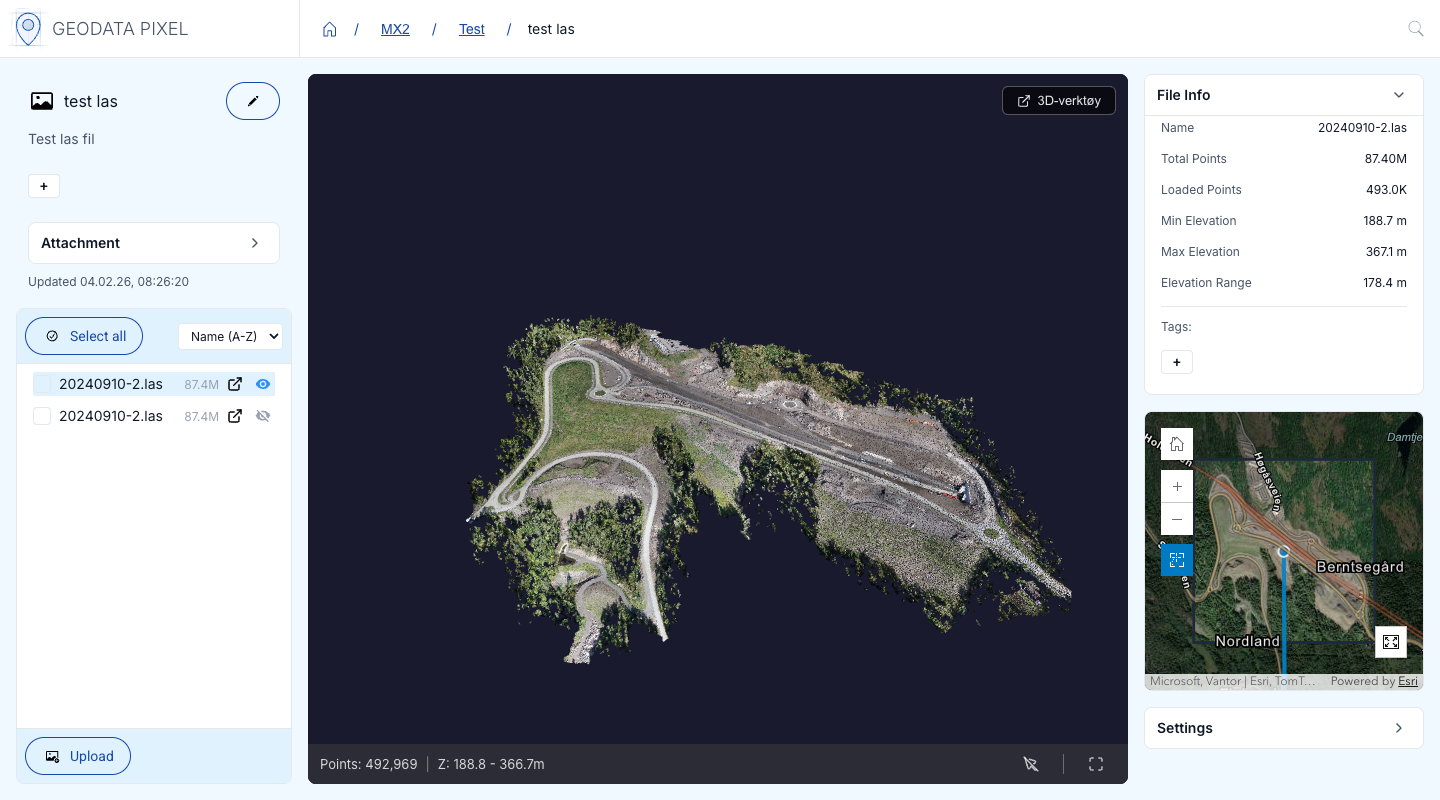
Point Cloud viewer
When you open a point cloud data collection, you enter the Point Cloud Viewer. The viewer has three panels:
- Left panel — File list with visibility toggles per file. You can show/hide individual files in the 3D view.
- Center panel — 3D point cloud renderer with interactive camera controls.
- Right panel — Collapsible sections for:
- Metadata — File information and properties.
- Minimap — Geographic overview showing the bounds of loaded point clouds.
- Controls — Adjust color mode, point size and point budget.
Color modes
Switch between different visualization modes for the point cloud:
- RGB — Display points with their original colors.
- Classification — Color points by classification category (ground, vegetation, buildings, etc.).
- Elevation — Color points by height.
- Intensity — Color points by return intensity.
Point picking
Click on individual points in the 3D view to inspect their properties. A popup displays the following information for the selected point:
- Classification — The classification category of the point.
- Elevation — Height value.
- Position — Geographic coordinates.
- Color — RGB color values.
- Intensity — Return intensity value.
Controls
- Point size — Adjust the visual size of individual points.
- Point budget — Set the maximum number of points to render (higher values = more detail but slower performance).
- Fullscreen — Toggle fullscreen mode for the 3D view.
- Open in Potree — Open the current view in the external Potree viewer for advanced visualization.
Minimap
The minimap in the right panel shows a geographic overview of the loaded point clouds. A camera frustum indicator shows the current camera position and viewing direction in the 3D view.
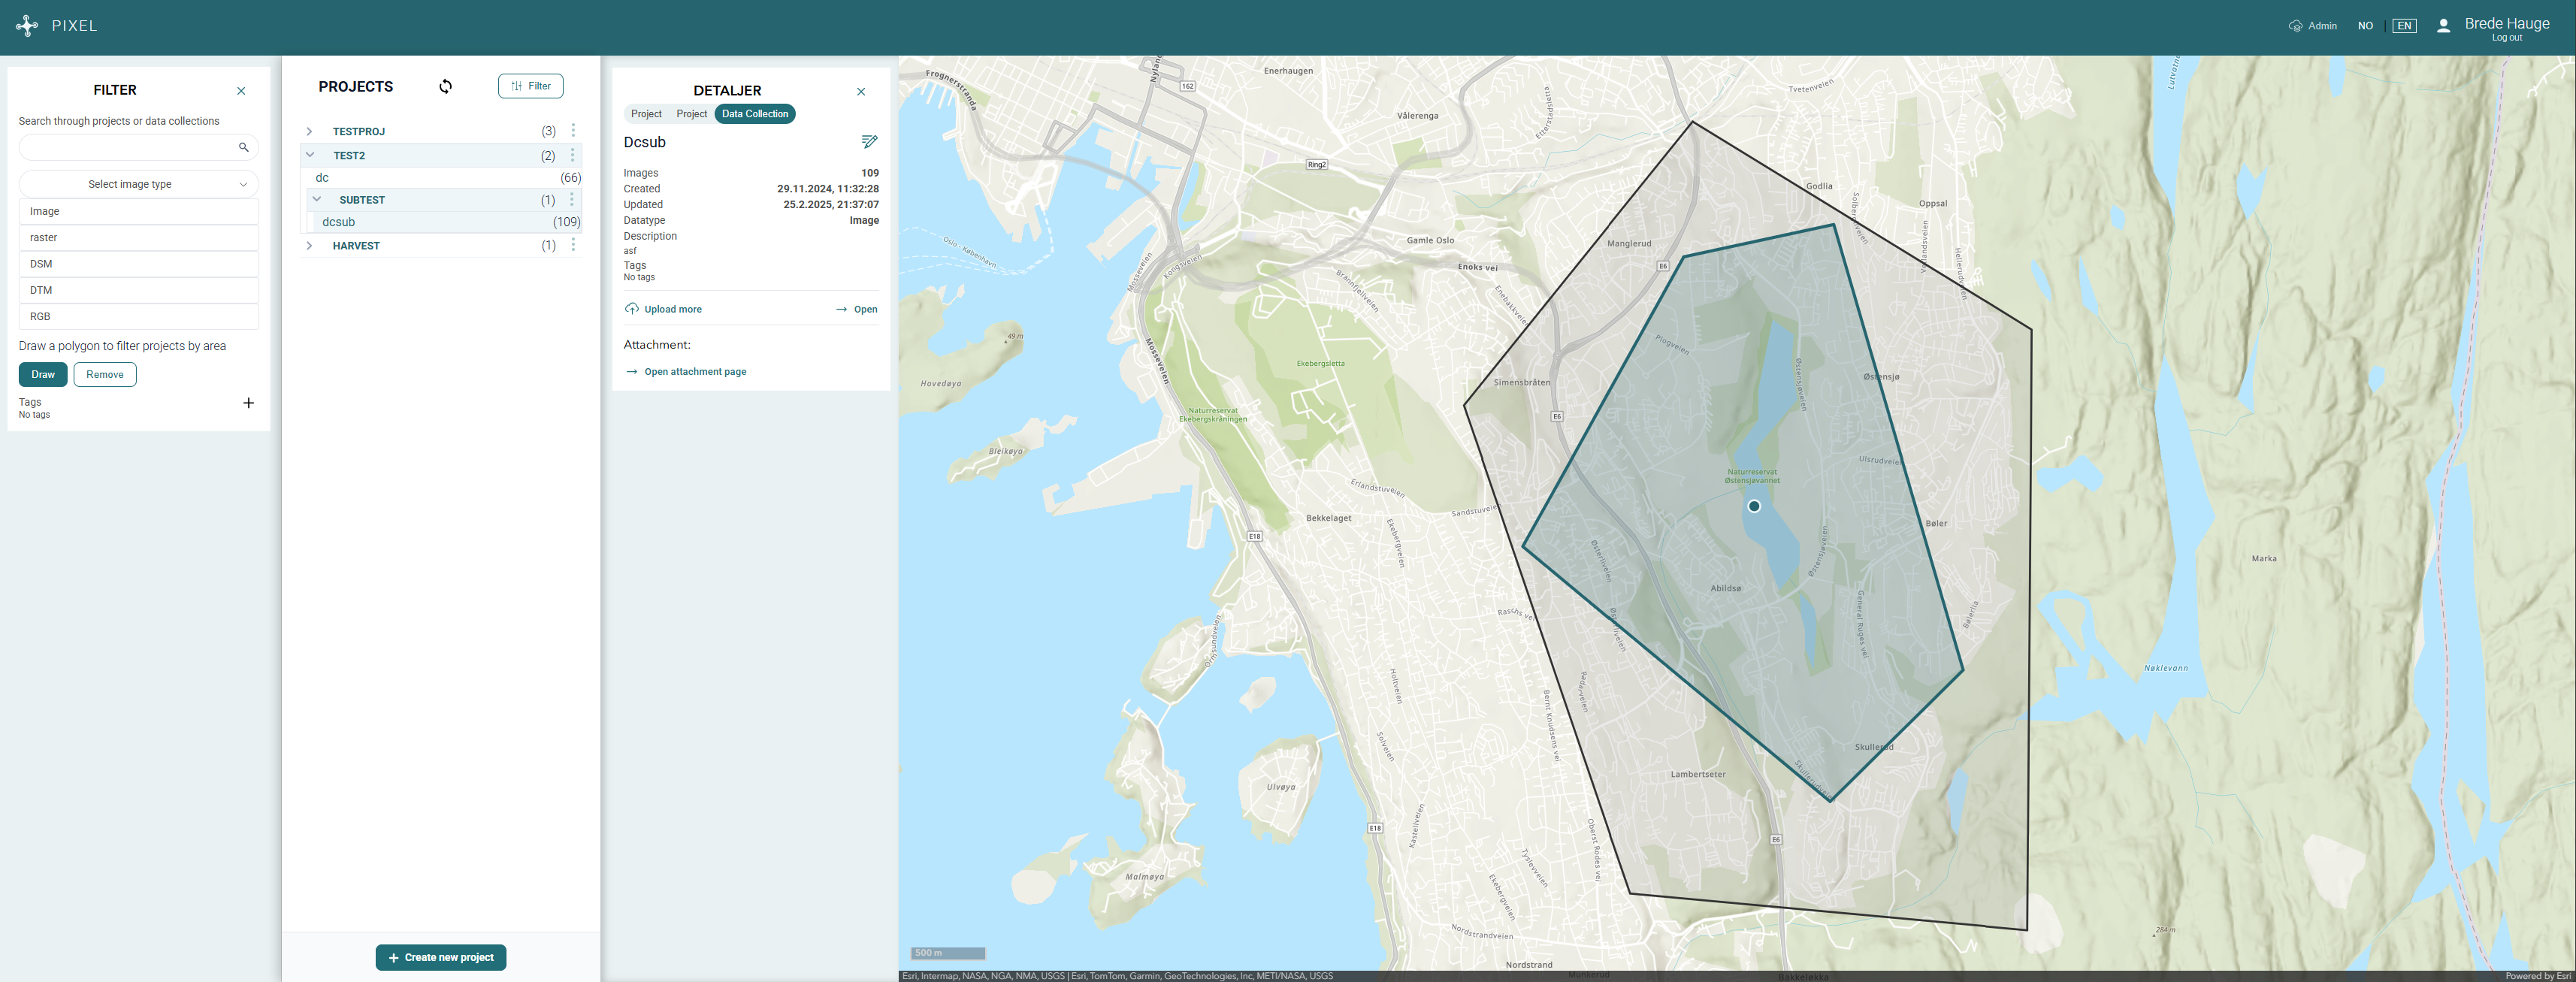
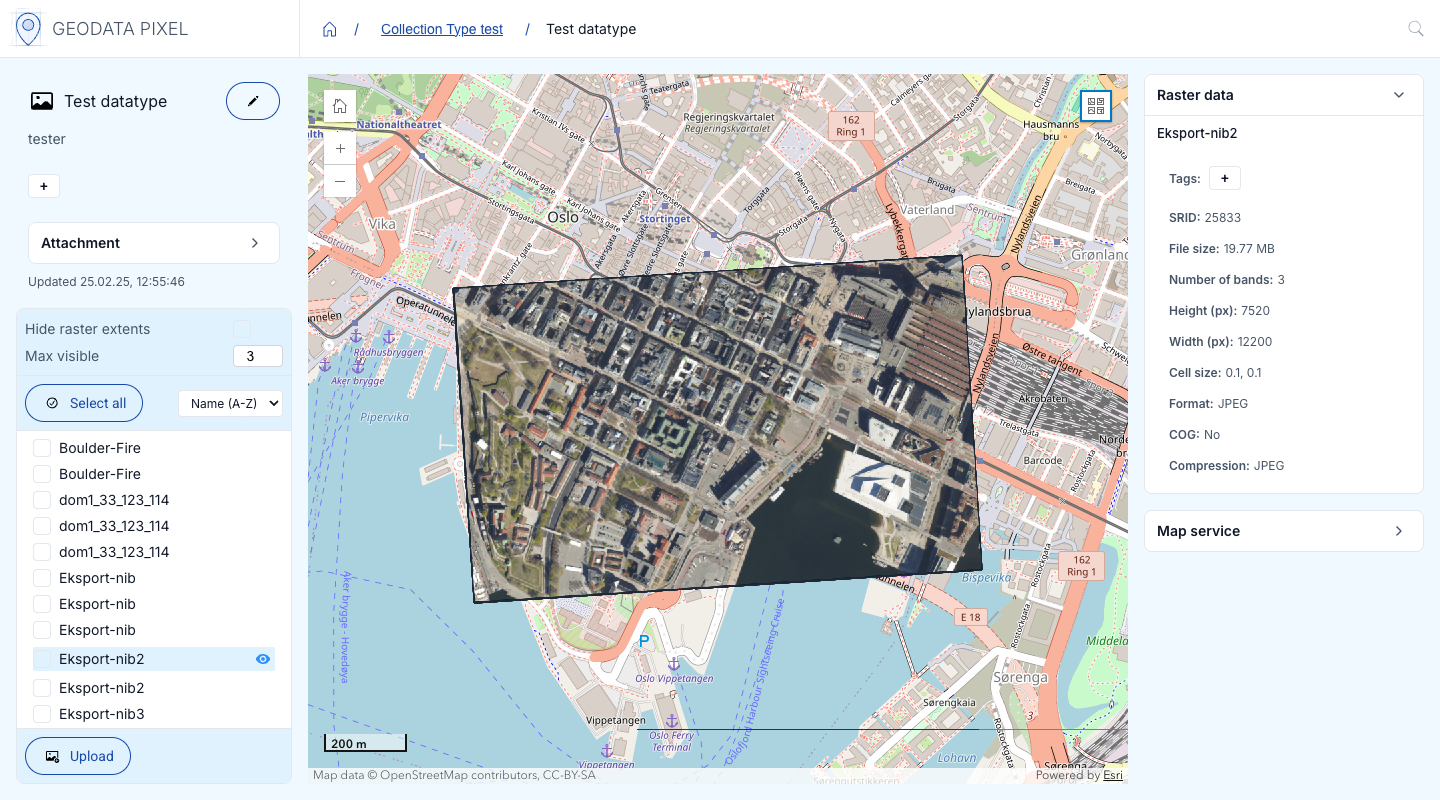
Raster viewer
When you open a raster data collection, you enter the Raster Viewer. The viewer displays raster data as a map overlay.
- Left panel — File list showing uploaded rasters. Each raster has a visibility toggle to show or hide it on the map. Multiple rasters can be displayed simultaneously.
- Center panel — Map display with the raster data overlaid. Raster extents are shown as blue rectangles on the map, making it easy to identify the coverage area of each file.
- Right panel — Metadata and services panel.
Rasters must be Cloud Optimized GeoTIFFs (COG) to be visualized in the viewer. You can either upload COG files directly or use the Optimize rasters feature to convert them.
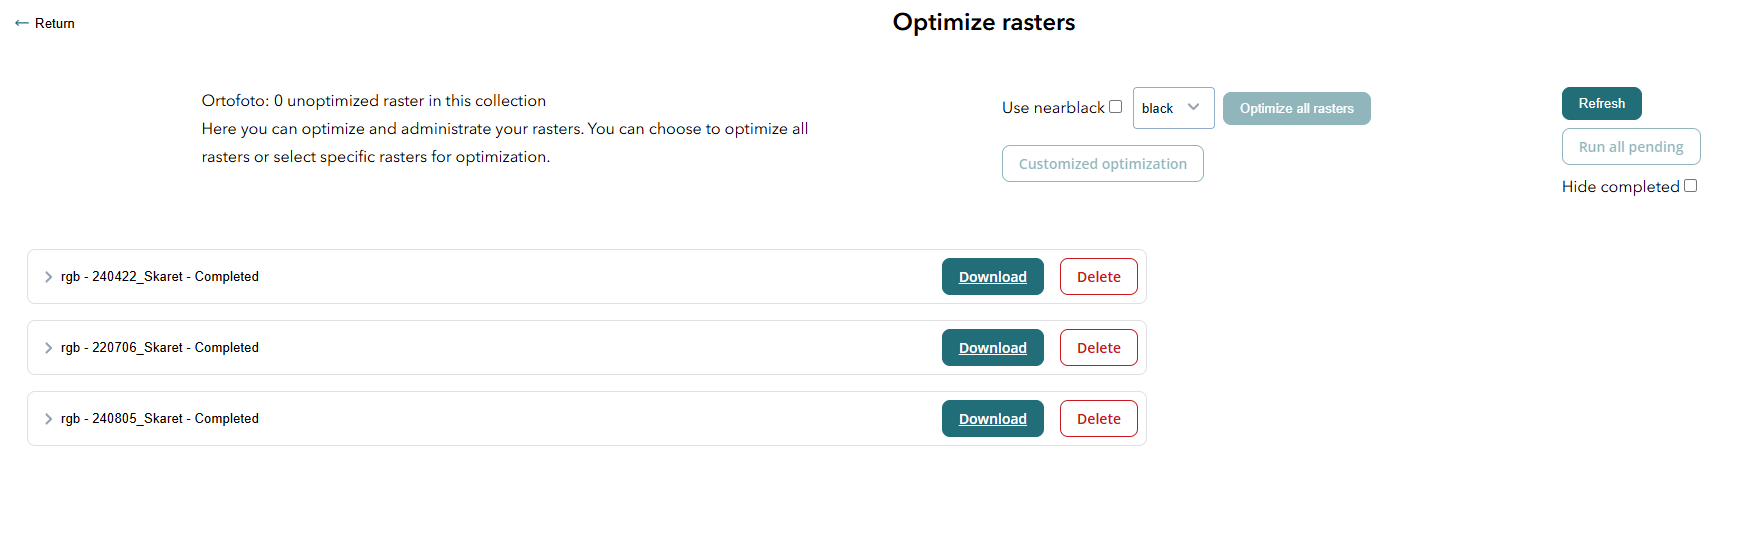
Optimize rasters
Optimization of rasters requires optimized_raster plugin
See note about plugins in Pixel for more information.
When you have uploaded rasters to a raster data collection, you can optimize them to create Cloud Optimized GeoTIFFs (COG). This is required for:
- Visualizing rasters in the web viewer.
- Publishing raster data as an ArcGIS Image Service.
Optimization is available for RGB, DTM and DSM data collections, and requires Editor or Admin permissions.
To optimize rasters:
- Open the raster data collection in the Raster Viewer.
- Select one or more rasters using the checkboxes in the file list.
- Click the Optimize button in the bottom action bar. This opens the optimization dialog.
- The dialog has two tabs:
Optimize tab — Configure and start new optimization jobs:
- Review the selected rasters.
- Enable Use nearblack to clean up border artifacts (enabled by default for RGB, see below).
- Select the nearblack color (black or white).
- Click Optimize rasters to start. The jobs are created and run automatically.
Administrate tab — Monitor and manage optimization jobs:
- Shows all optimization jobs grouped by status:
- Pending — Created but not yet running.
- Submitted — Queued for processing.
- In progress — Currently being processed.
- Completed — Successfully optimized. A download button appears.
- Failed — The optimization failed. A Retry button appears.
- The status auto-refreshes every 15 seconds. You can also click Refresh manually.
- Click the download icon to download the optimized raster (COG).
- Click the trash icon to delete an optimization job.
Apply Nearblack
If your rasters are compressed (usually JPEG) and have 3 bands, they may have artifacts at the borders. The Nearblack option in the optimization dialog cleans up these artifacts by filling near-black or near-white pixels in the background. Choose the color (black or white) depending on the background pixel values of your rasters.
Code samples for optimizing rasters
Code samples for optimizing rasters can be found in the Python Client Documentation.
Tags
Geodata Pixel has a flexible tagging system for all elements. Tags can be added to projects, data collections and individual images. Tags are searchable throughout the application and are available through the API.
Automatic tagging
When images are uploaded to an image data collection, automatic tagging is performed using machine learning. This identifies objects such as cars, boats and other items in the images. When uploading through the API, you can also specify custom tags automatically.
Manual tagging
All elements can be manually tagged. Projects and subprojects are tagged when creating or editing them. Images can be tagged through the image viewer or using bulk edit.
Attachments
Geodata Pixel allows you to attach arbitrary files to projects and data collections. This is useful for storing additional information such as reports, documents or other relevant files.
The attachments panel appears as a collapsible section in multiple places:
- Project dashboard — Below the data collection cards.
- Data collection preview — In the metadata panel.
- Data viewer — In the right sidebar.
The panel shows the number of attachments and is collapsed by default. Expand it to see the list of attached files.
Upload attachments
- Click the Upload button (cloud icon) in the attachments panel. This opens the upload dialog.
- Drag and drop files into the drop zone, or click Choose files from device to browse.
- Review the pending files — you can remove individual files before uploading.
- Click Upload attachments to upload all files.
Download, edit and delete
Each attachment in the list shows a file icon, name and date. The following actions are available:
- Download (cloud download icon) — Download the file. Only available for completed attachments.
- Edit — Update the attachment name and description.
- Delete (trash icon) — Remove the attachment. A confirmation dialog will appear. Requires Editor or Admin permissions.
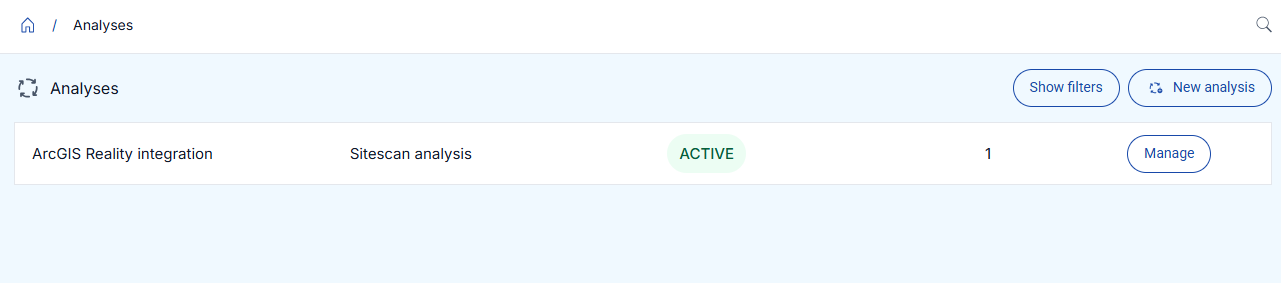
Analysis
Beta functionality
Analysis is currently released as a beta feature. The available analysis types and their options may change as the functionality matures.
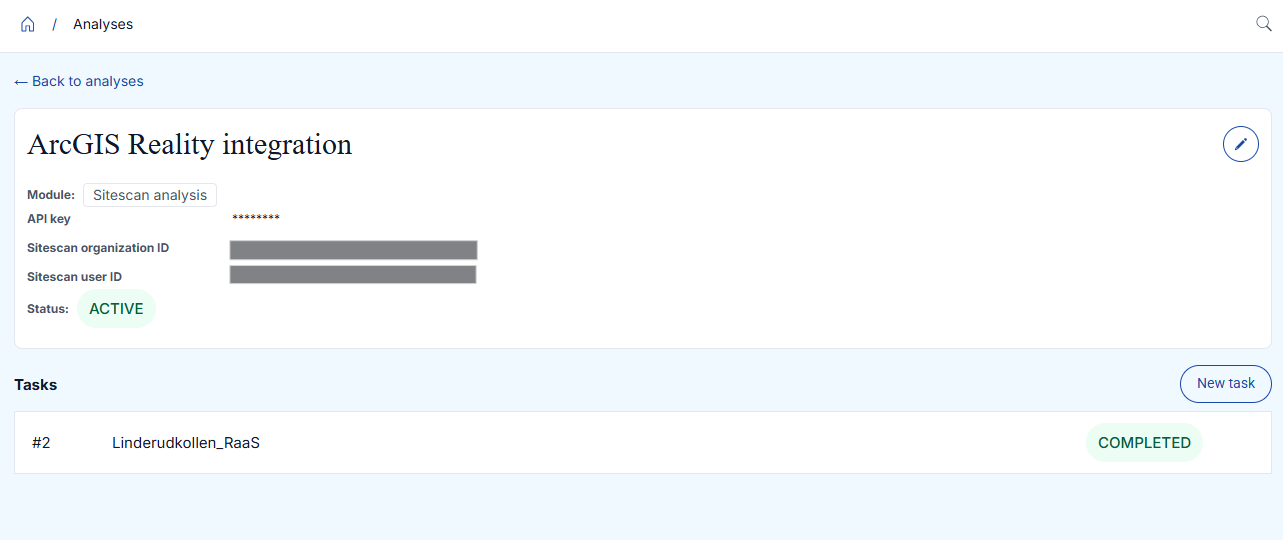
Geodata Pixel can run analysis on your data through analysis services. Analysis is built around three concepts:
- Analysis module – a type of analysis that can be run. Each module defines the options it needs to be configured with and the parameters required for each run.
- Analysis service – a configured instance of a module. A service is given a name and a configuration, and can be enabled or disabled.
- Analysis task – a single run of a service. Each task is created with its own parameters and can be started, monitored and, if needed, cancelled.
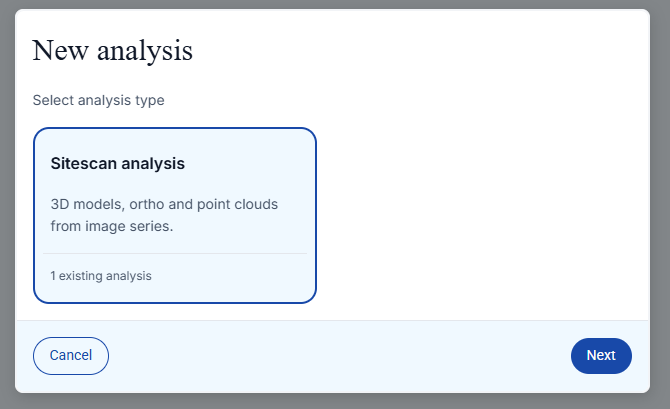
Create an analysis service
To set up analysis, you first create an analysis service:
- Open the analysis interface and choose to create a new analysis service.
- Select the analysis module you want to use.
- Give the service a descriptive name.
- Fill in the configuration for the selected module. The available options depend on the module you selected.
- Save the service.
You can edit a service later to change its name or configuration, or to enable and disable it. The module a service is based on cannot be changed after the service is created — create a new service if you need a different module.
Run analysis tasks
Once a service exists, you run analysis by creating and running tasks:
- Open the analysis service.
- Create a new task and provide the parameters for the run.
- Start the task.
Each task has a status that shows its progress:
| Status | Description |
|---|---|
| Pending | The task has been created and is waiting to be scheduled. |
| Scheduled | The task has been scheduled for execution. |
| Running | The task is currently being processed. |
| Success | The task completed successfully. |
| Failed | The task failed during processing. |
| Revoked | The task was cancelled before it finished. |
You can cancel a task that has not yet finished. Tasks you no longer need, and services that are no longer in use, can be deleted.
Not all tasks can be deleted
Whether a task can be deleted is module-specific. Some analysis modules do not allow their tasks to be deleted, so the delete option may not be available for every task.
Technical details
Analysis is also available through the Python client. For a programmatic walkthrough with code samples, see the Python Client Documentation.
Administration
The administration pages are accessible from the left sidebar. The available pages depend on your user role.
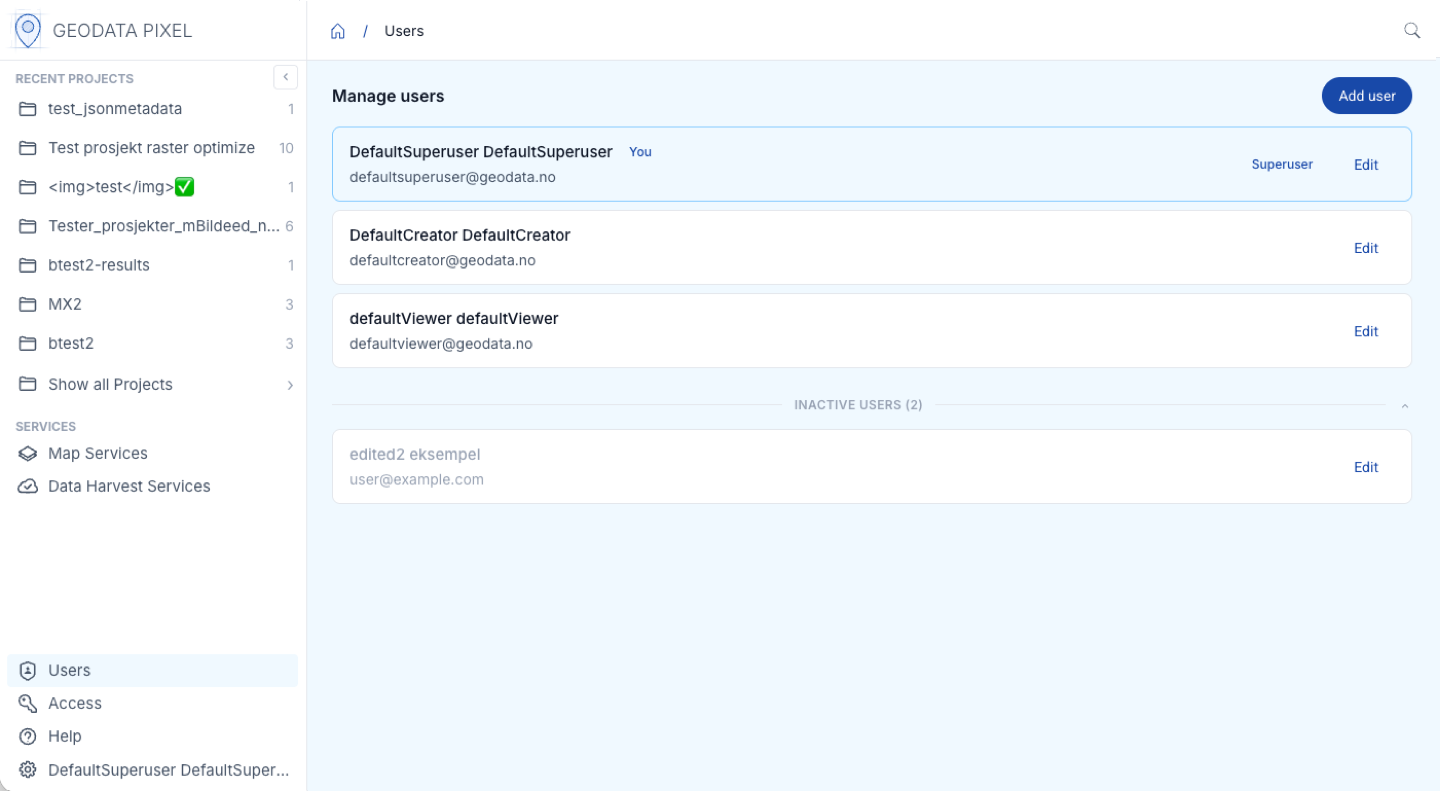
User management
From the user management page, you can manage users in your organization. This includes adding new users, editing existing users and deactivating users.
Permissions to manage users
Only superusers can manage other users.
Add new user
Click the Add user button and fill in the required information:
- Email address
- First name and surname
- Password
- User type
- Active status
User types:
| User type | Description |
|---|---|
| Viewer | Read-only access. Can view projects and data collections but cannot create or edit them. |
| Editor | Can create and edit projects and data collections. |
| Superuser | Full access to the application, including user management and settings. |
User types and permissions
User types are application-level permissions. Viewers cannot perform create, update or delete operations even if they have an Admin role on a project. Superusers have full edit capabilities on all projects regardless of their project role.
Editor vs. Creator
The Editor user type may also be referred to as "Creator" in the API. Both terms refer to the same permission level.
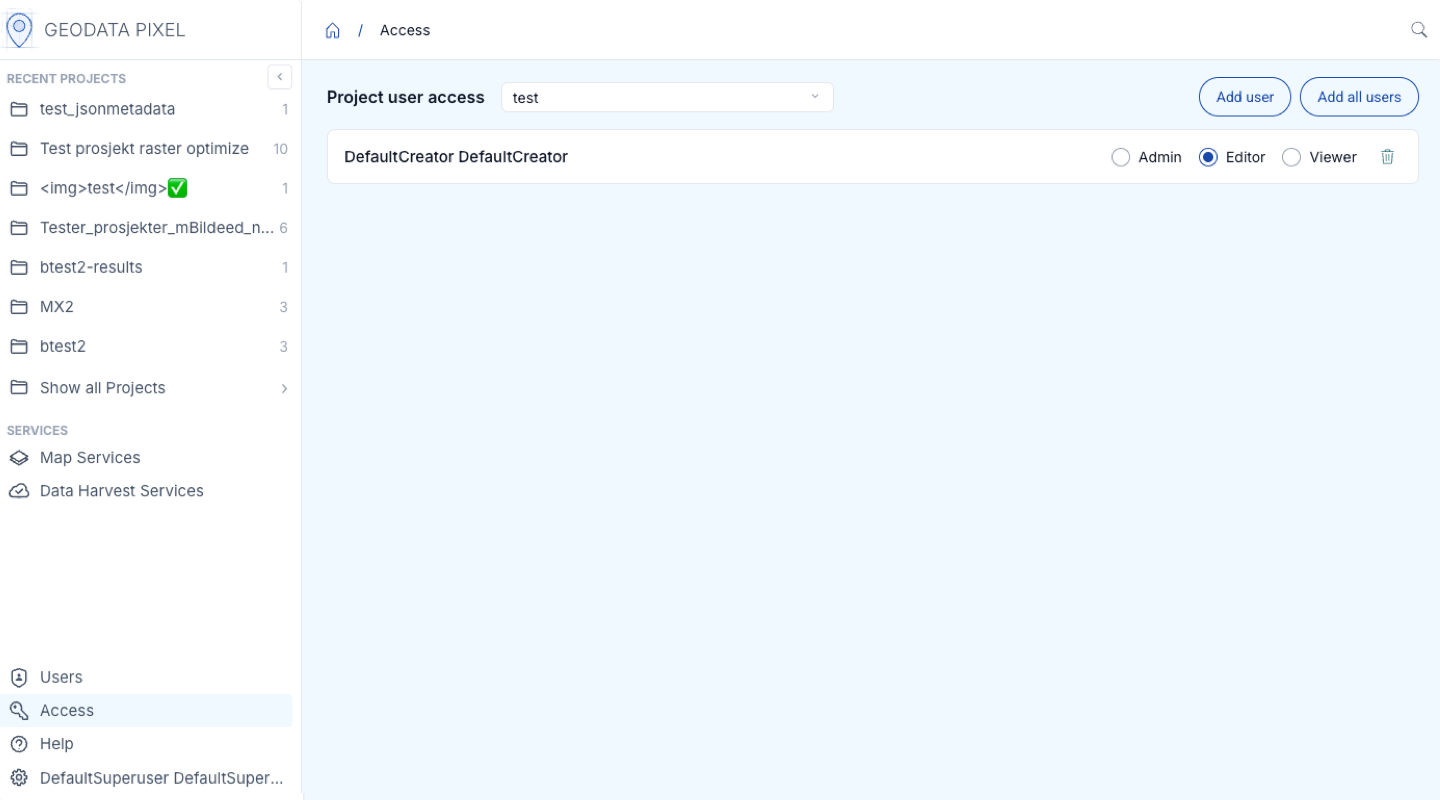
Project access
Access control is managed at the project level. When a project is created, only the creator has access. To share access with other users:
- Navigate to Access in the left sidebar.
- Select a project from the project list.
- Click Add user and select a user from the dropdown.
- Assign a role:
| Role | Description |
|---|---|
| Admin | Full access to the project, including managing access for other users |
| Editor | Can create and edit data collections and data within the project |
| Viewer | Read-only access to the project |
- Click save to apply the changes.
To remove a user's access, find the user in the access list and click the delete icon.
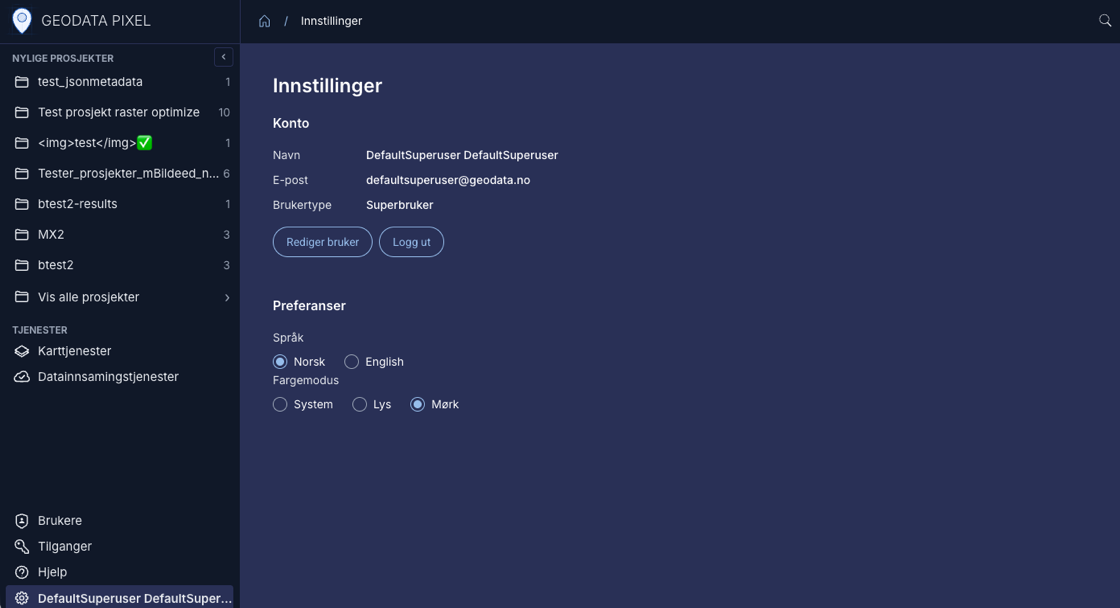
Settings
The settings page is accessible from the left sidebar. Here you can:
- View account information — See your name, email and account type.
- Edit user — Update your account details.
- Preferences:
- Language — Switch between Norwegian and English. The change takes effect immediately.
- Color mode — Choose between System, Light or Dark mode. System follows your device settings.
- Log out — Sign out of the application.
Data harvesting
Geodata Pixel allows you to configure automatic harvesting of images from your own ArcGIS Feature Services.
Create a new harvester
Click New harvest service and select the data collection to harvest into from the dropdown. Then fill in the multi-step form:
- Name and description — Provide a name and description for the harvester.
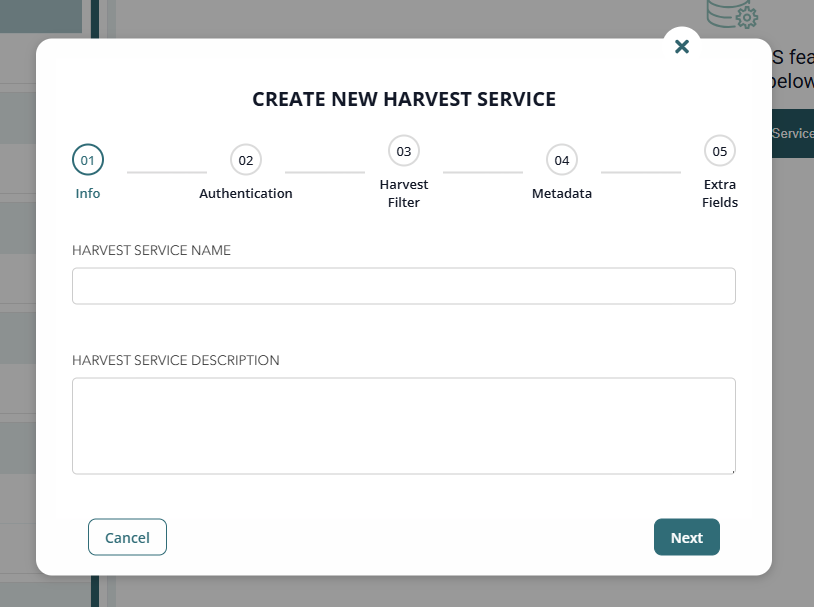
- Authentication — Provide the ArcGIS Feature Service URL and authentication details (credentials or API key).
- Harvest filter — Optionally specify an SQL where clause to filter which images to harvest. Use the Test query button to validate the where clause against the ArcGIS Feature Service before proceeding. The test returns matching feature count to verify the filter works as expected.
- Harvest metadata — Map fields from the ArcGIS Feature Service to Geodata Pixel metadata fields.
- Extra fields — Configure a field that Pixel will write to on the Feature Service when images are harvested. You can also add additional metadata fields.
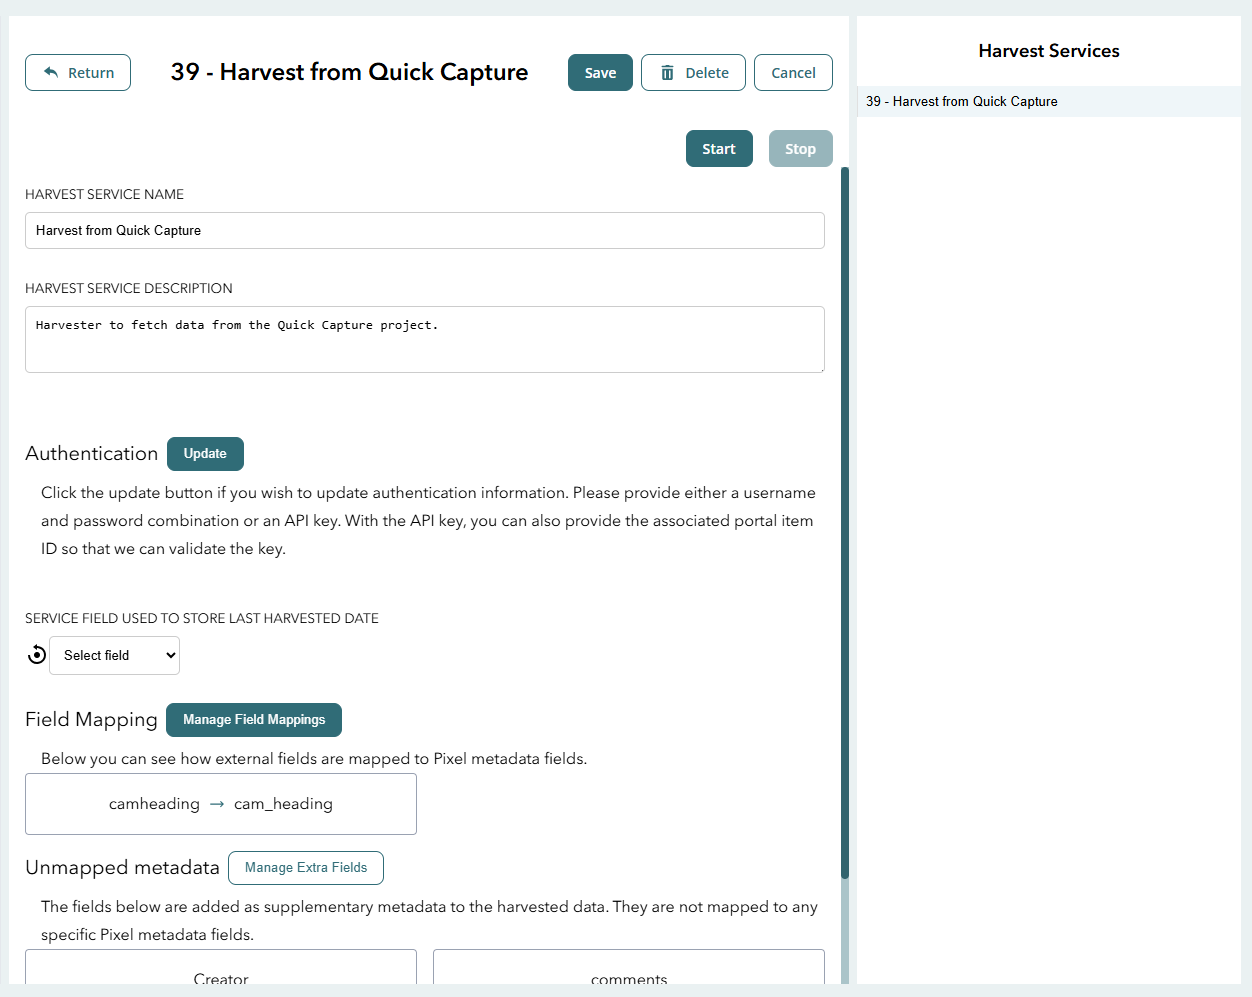
Manage harvesters
After creating a harvester, it appears as a card on the Data Harvest Services page with its name, description and status (Activated/Inactive). Click on a harvester card to open its details page.
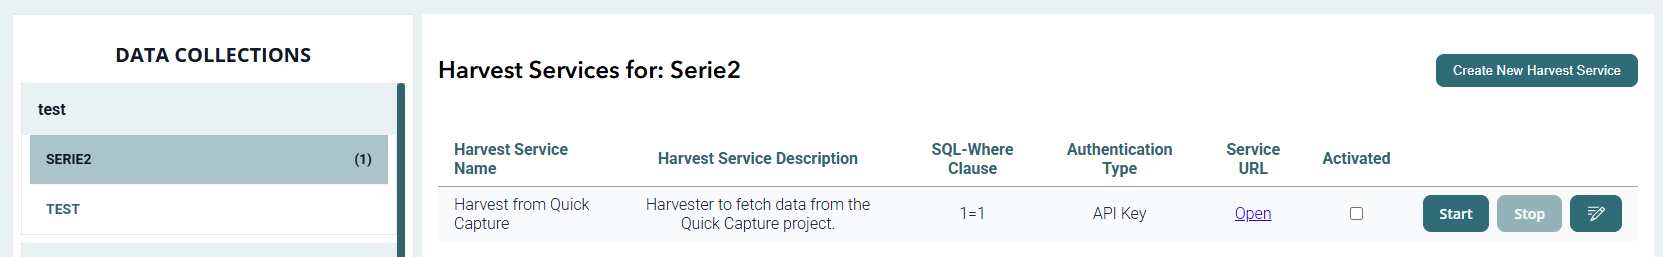
The details page shows the current configuration including authentication, filter, metadata mapping and field mapping. From here you can Edit the configuration, Start or Stop the harvester, or Delete Harvest Service.
Pointing to another service
The ArcGIS Feature Service URL cannot be changed after creation. To change the service, create a new harvester.
Deleting the service
Pixel uses a task log to track harvested features. The task log is deleted with the harvester, so deleting and recreating a harvester will re-harvest all features.
ArcGIS Services
All data uploaded to Geodata Pixel can be published through ArcGIS services (Feature and Image). This is accessible from Map Services in the left sidebar.
Superuser Privileges Required
Only superusers can create and manage ArcGIS services. See the User Management section for more information.
Overview of published services
The Map Services page shows an overview of existing Feature and Image services. Switch between service types using the tabs.
You can search for services by name using the filter search field, and toggle between List and Card view to display services in a table or as cards. Pin frequently used services by clicking the pin icon — pinned services appear at the top of the list for quick access.
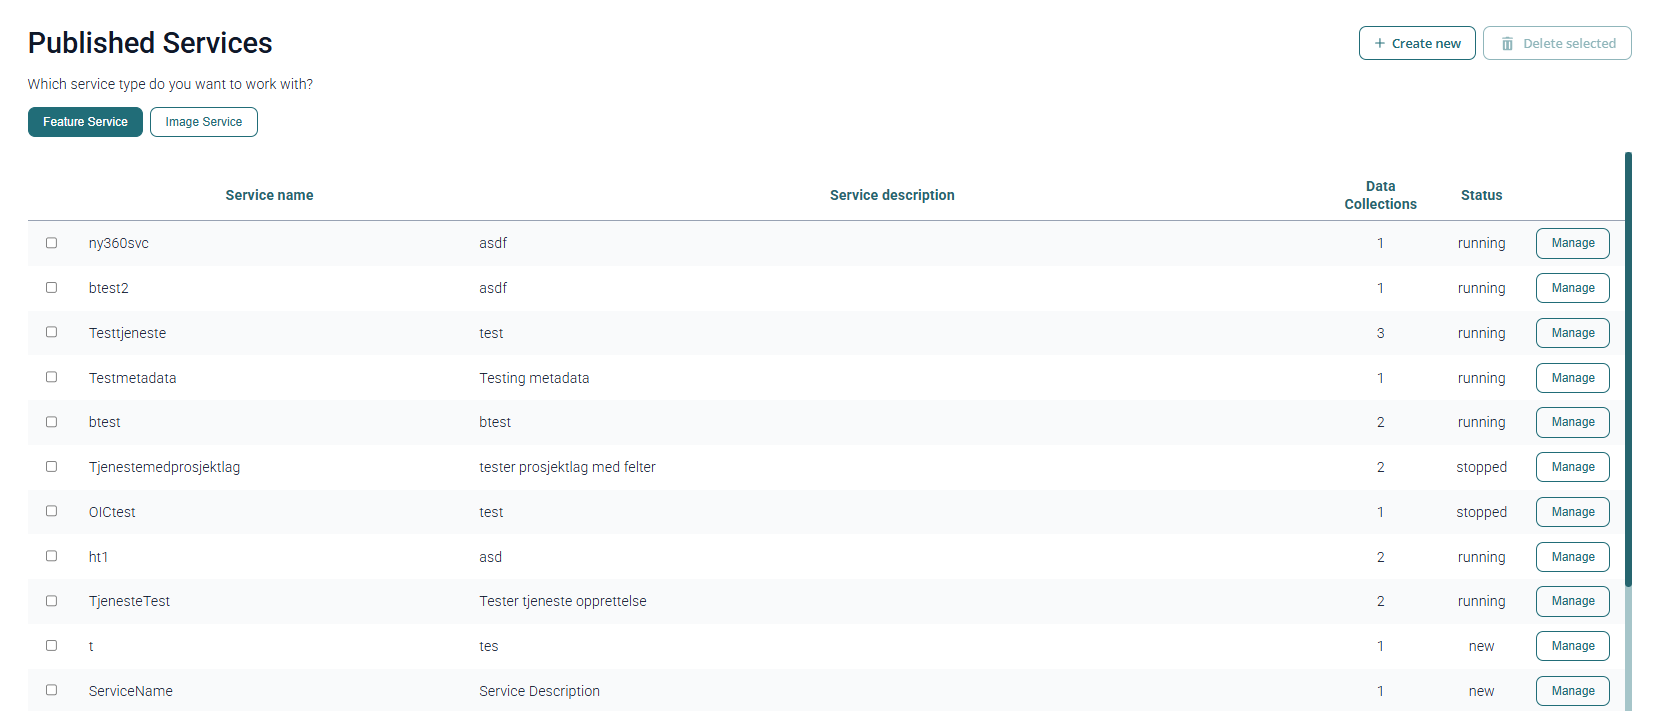
Service information:
- Service name and description — Information associated with each service.
- Data Collections — Number of data collections included.
- Status:
- new — Created but not yet started.
- running — Currently running and available for use.
- stopped — Stopped and not currently available.
- failed — Encountered an error.
- out_of_sync — Updated but not refreshed to reflect changes.
- updating — Currently being updated.
Accessing Secured Services
Access to a secure service
If the service is configured with GDO user access control, you can generate tokens through
Geodata Online token service. Use the token via the token query parameter, Authorization or X-Esri-Authorization header.
Examples with cURL:
// With X-Esri-Authorization header
curl -X GET "<SERVICE_URL>" -H "X-Esri-Authorization: Bearer <YOUR_ACCESS_TOKEN>"
// With query parameter
curl -X GET "<SERVICE_URL>?token=<YOUR_ACCESS_TOKEN>"
// With Authorization header
curl -X GET "<SERVICE_URL>" -H "Authorization: Bearer <YOUR_ACCESS_TOKEN>"
Feature Services
Feature services expose images as point features through ArcGIS Feature Services. Each image is represented as a point with associated metadata.
Create new feature service
Click New feature service and fill in:
- Service name — Name of the service.
- Service description — Description of the service contents.
- Access — Choose whether the service is open to everyone or protected with GDO access control.
- Include project layer — Optionally expose parent projects as a layer in the service.
- Oriented imagery — Enable oriented imagery capability for the image layer.
- Data collections — Select which data collections to include.
- Image version — Choose between original or blurred images.
- Fields — Select which fields to include on the Image and Project layers. Use "Include all" or select a subset. Note required fields listed on the page.
Required fields
There are different required fields depending on whether oriented imagery is enabled. Attempting to publish with missing required fields will fail.
Service administration
To manage a feature service, click the manage button. You can:
- Start or stop the service.
- Copy the service URL.
- View included data collections.
- Edit the service configuration.
Editing services
In edit mode, you can change:
- Service name and description
- Project layer inclusion
- GDO user access
- Image version (original or blurred)
- Data collections included
- Fields included in each layer
Image Services
Image services expose raster data (RGB, DTM and DSM) through ArcGIS Image Services.
Image service requires image_service plugin
The image service plugin and the optimized_raster plugin are required. See plugins in Pixel for more information.
Create new image service
Options for image services:
- Service name — Name of the service.
- Service description — Description of the service contents.
- Data collections — Select data collections to include. RGB collections are exposed as RGB imagery, DTM/DSM as Elevation imagery. Only collections of the same type can be combined.
- Default service SRID — Select a spatial reference close to your area of interest for best performance.
- Enable WMS — Enable WMS capabilities with configurable title, abstract and supported SRIDs.
- GDO Users — Manage access control.
Optimize rasters
Image services require all rasters to be optimized. See Optimize rasters.
Image service administration
The service management page shows configuration and status. Available actions:
- Edit — Change service configuration.
- Stop service — Stop a running service.
- Refresh service — Update the data the service exposes.
- Start service — Start a stopped or new service.
- Delete service — Delete a stopped service.
Data in the service
Service data is static at creation or last refresh. If new data is added to included data collections, the service must be refreshed. Automatic refresh occurs every 24 hours.
The page also shows service sizing (number of replicas and server size). Contact Geodata to adjust scaling.
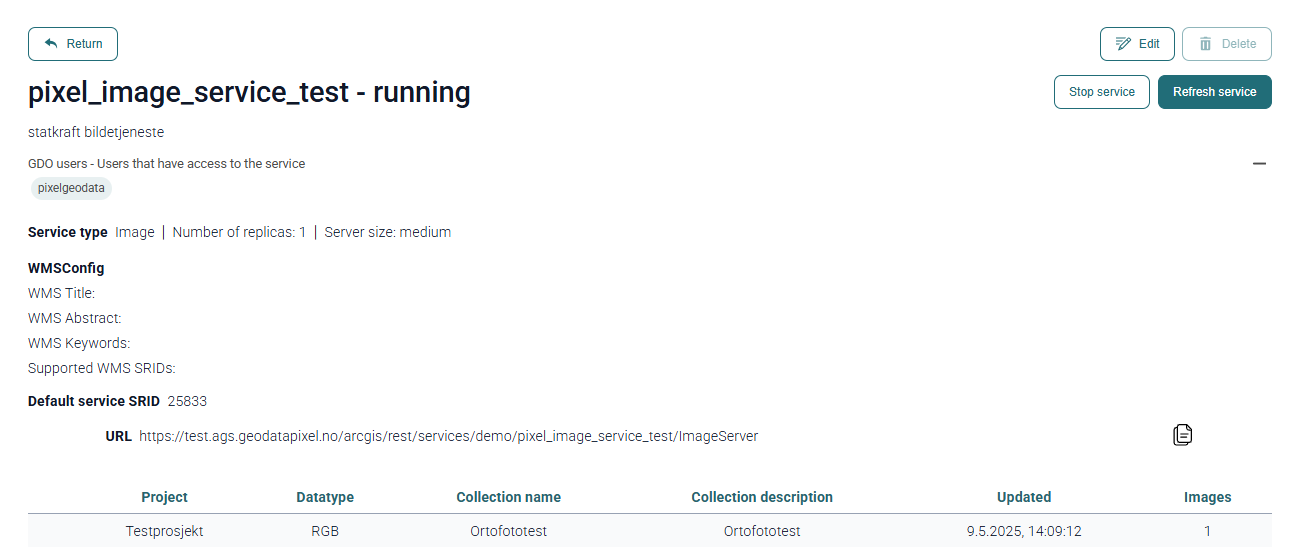
Image Service best practices
Image Service Types
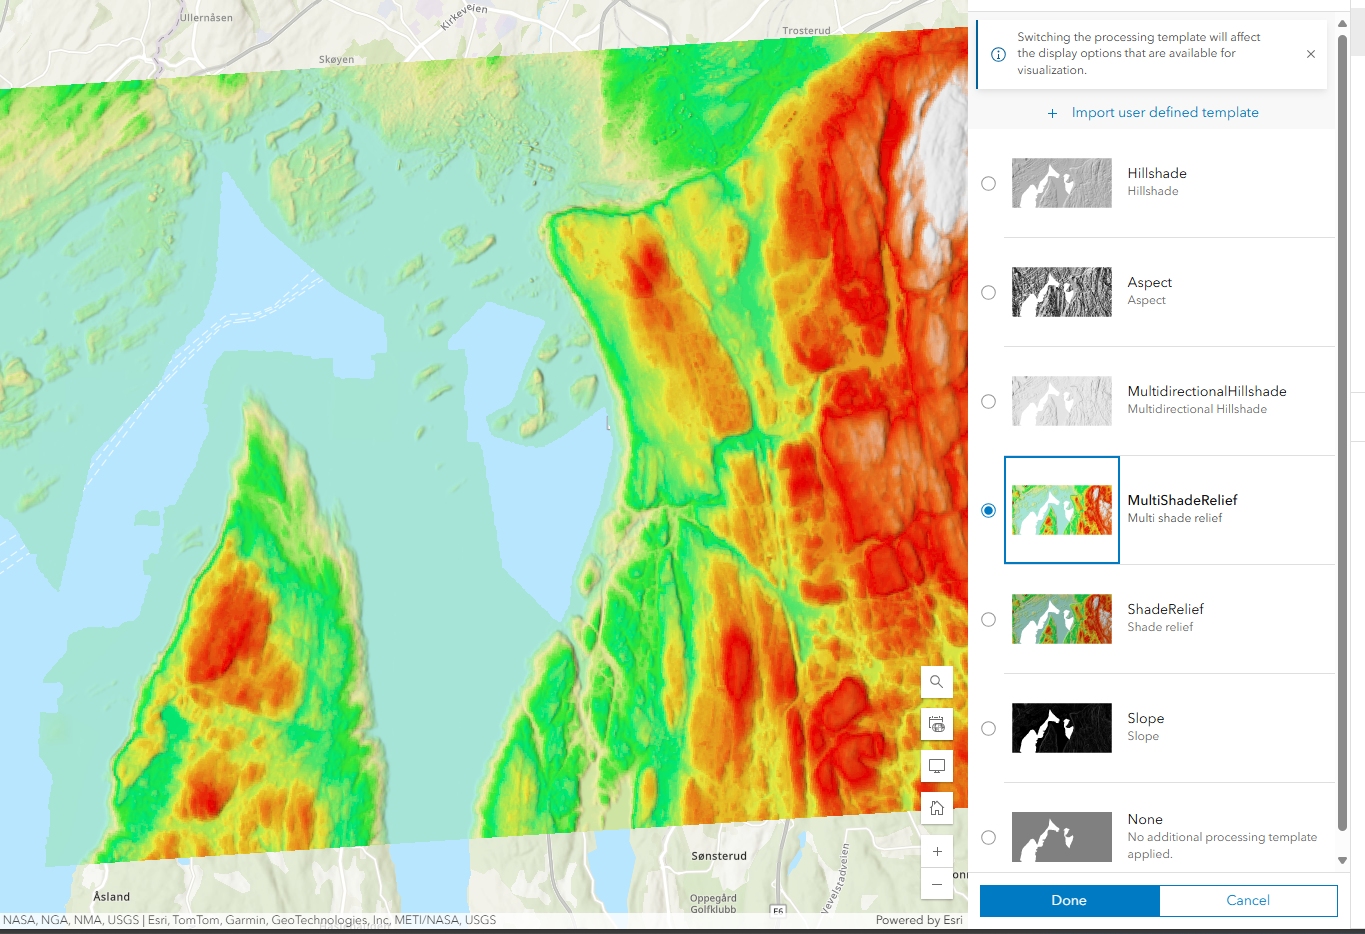
Pixel automatically creates the appropriate service type:
- RGB data collections are published as a processed image service.
- DTM/DSM data collections are published as elevation services with raster functions: Hillshade, Slope, Aspect, Multidirectional Hillshade, Multi Shade Relief, Shade Relief.
Collect similar data into the same service
Group similar data collections into the same service. For example, if collecting RGB imagery from multiple drone flights, create separate data collections per flight but group them into a single image service. The service supports filtering by data collection name, project name and tags.
Supported clients
Pixel image services support ArcGIS Online, ArcGIS Enterprise, web maps and ArcGIS JavaScript API. In ArcGIS Pro, add the service via Add Data > Data from Path and enter the service URL.
If WMS is enabled, the service can be used in any WMS-compatible client, including QGIS.
Filtering data in the service
Filter data based on data collection names, project names and tags when adding the service to a client. For WMS, use the QUERY or IMAGES parameter. See Filtering images in WMS requests.
Integration with Esri products
When you create services in Geodata Pixel, these are ArcGIS Feature and Image services. These services are primarily supported by Esri products. Whether or not images are supported depends on the specific solutions that you use.
The most common way to make the services available is through your own Portal. This applies to both ArcGIS Online and ArcGIS Enterprise.
| Resource | URL |
|---|---|
| Using services in ArcGIS Enterprise | Connect to secure services - Portal for ArcGIS | Documentation for ArcGIS Enterprise |
| Using services in web maps in ArcGIS Online | Add layers from a URL - ArcGIS Online Help | Documentation |
| Using services in ArcGIS Pro | Add a web feature layer for editing - ArcGIS Pro | Documentation |
Format requirements
Use of metadata in the solution (Exif information)
Geodata Pixel uses metadata from the images that are uploaded. Therefore, it is important that the images hold this metadata.
Challenges with metadata
There is no standard for what metadata should look like, and different camera manufacturers use different formats. This can lead to challenges with metadata from your camera. The application supports most known variants, but some formats may lack support.
What you can do
If you experience problems with metadata from your camera, send Geodata a sample image. Geodata will then add support for that variant in an updated version of the application.
API
Swagger documentation for the API can be found here: https://prod.api.geodatapixel.no/{customer}/docs where {customer} needs to be replaced with your own tenant name. This is the same name that you find in the URL when accessing the application.